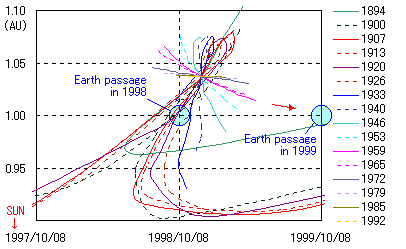
fig.1 The distribution of a trail.

fig.1 The distribution of a trail.
A trail is is complicated the reason of greatly influenced of Jupiter (Fig.1).
Some trails have passed through near an earth orbit in 1998.
Table.1 The precise calculation result of a trail in 1998.
| Released year | Released speed | Position | Date | Time (UT) | Ls. (2000.0) | Distance (AU) |
|---|---|---|---|---|---|---|
| 1907 | +6.0m/s | Descending node. Minimum point. | Oct. 8 Oct. 8 | 16h15m 12h20m | 195.202 195.045 | +0.0135 +0.0134 |
| 1913 | +6.7m/s | Descending node. Minimum point. | Oct. 8 Oct. 8 | 15h22m 12h20m | 195.166 195.045 | +0.0108 +0.0107 |
| 1920 | +8.2m/s | Descending node. Minimum point. | Oct. 8 Oct. 8 | 14h34m 12h25m | 195.133 195.049 | +0.0066 +0.0066 |
| 1926 | +10.8m/s | Descending node. Minimum point. | Oct. 8 Oct. 8 | 13h33m 13h25m | 195.091 195.090 | +0.0004 +0.0004 |
| 1933 | +15.4m/s | Descending node. Minimum point. | Oct. 8 Oct. 8 | 11h56m 14h35m | 195.025 195.138 | -0.0094 -0.0094 |

Fig.2Å@The position of trails in 1998.
According to the calculation result, The trail which approaches the earth most was a trail of the 1926 origin.
It was that the earth passed descending node of this trail at 13:33(UT) and was minimum point around 13:25(UT) on October 8. Approach distance was +0.0004 AU. This distance was smaller than the calculation error (about 0.001 AU).
The peak from the observation result in 1998 was around 13:10(UT), the difference was in agreement with dozens of minutes.
Table.2 The precise calculation result of a trail in 1999.
| Released year | Released speed | Position | Date | Time (UT) | Ls. (2000.0) | Distance (AU) |
|---|---|---|---|---|---|---|
| 1959 | +60.0m/s | Descending node. Minimum point. | 10/9 10/9 | 10h48m 11h25m | 195.712 195.740 | -0.0027 -0.0026 |
| 1966 | +69.5m/s | Descending node. Minimum point. | 10/9 10/9 | 11h57m 12h25m | 195.760 195.782 | -0.0015 -0.0015 |

Fig.3Å@The position of trails in 1999.
According to the calculation result, approaching to 0.001 to 0.003 AU was proved that they are both these two trails. However, the released speed is over +60 m/s, and the dust is likely to be distributed by low density.
The peak from the observation result in 1999 was around 11:00(UT) on October 9, the hourly rate(HR) was about 20 to 30. The approach time with the trail from 1959 was in agreement with the error of dozens of minutes.
And, the hourly rate(HR) was about 5 to 10 around 12:00(UT) , a possibility that this originates in the trail from 1966 is also considered.
In addition, the influence of radiation pressure is not included in these calculation. If calculation is further advanced including this influence, the still better result will be drawn.